Building Observability for Microservices
Enhancing the efficiency and reliability of microservices by setting up observability using Prometheus, Grafana.
Let’s say you distribute the work that a single highly experienced person is doing to multiple individuals, each performing a specific task. Distributing the work this way may increase throughput and eliminate the single point of failure. However, now you have to monitor many people instead of just one! Observability in microservices addresses a similar issue: how to monitor and proactively address problems in a distributed system? The solution lies in measuring the state of a system through metrics recorded for each of its services. A more software-specific definition is (ref. Wikipedia)
Observability is a measure of how well the internal states of a system can be inferred from knowledge of its external outputs.
This article explains setting up an observability stack for Microservices and what to measure to ascertain the health and performance of the system, sharing our experiences from operating observability for Microservices at NimbleWork.
The Tools
There are a lot of tools, paid and open source, in the Observability space. We at NimbleWork though prefer the following stack
1. Prometheus — an open-source toolkit for monitors and alerts built at SoundCloud
2. Grafana — a visualisation and analytics data from multiple sources, including Prometheus
3. Helm — a tool to manage Kubernetes applications
4. kubectl — a command line tool for working on Kubernetes clusters
5. Terraform — a tool to automate the provisioning of infrastructure on clouds such as AWS.
We’re running this on Kubernetes, specifically on AWS EKS which is also the choice for running microservices at NimbleWork. Let’s dive into getting things working! The post assumes you have a working EKS cluster, you can choose AWS Fargate as described in this blog post, or Worker Node cluster as described here.
Prometheus on EKS
Let’s look at deploying Prometheus first as it serves as a data source for Grafana.
Preparing Volumes on EKS Node Group.
We will be using persistent storage for Prometheus data as it’s a bad idea to keep crucial observability data in ephemeral storage. So we declare the volumes first. Since we’re using EKS NodeGroups we have to configure Persistent Volumes using EBS for the Prometheus node. EFS here is a bad idea as Prometheus does not support NFS well enough. While you can certainly get it running on EFS, it remains unstable with sudden restarts related to errors in the logs about NFS writes. This link in Prometheus documentation strongly recommends against it.
Let’s configure our EKS cluster for EBS storage using Terraform, here’s a snippet you’d typically add to a storage.tf file in the Terraform module you’ll write for managing EKS, we’re following the same structure as in the blog post on setting up EKS via terraform that you can use for reference. You can of course do it manually but there’s a reason why IAC exits, and I like to respect it!
Running the terraform script gives, amongst other things, the values of File System and its Access Point ID in the output which we’ll then use in our helm charts.
Deploying Prometheus via Helm
We prefer the community helm chart for Prometheus, available on GitHub, install the chart using the following command
helm repo add prometheus-community https://prometheus-community.github.io/helm-charts
Now, let’s look at how can we configure it to work with EKS NodeGroups. Create a volumes.yaml file with the following contents.
apiVersion: v1
kind: PersistentVolume
metadata:
  name: prometheus-volume-0
  labels:
    type: prometheus-volume
spec:
  capacity:
    storage: 10Gi
  volumeMode: Filesystem
  accessModes:
    - ReadWriteMany
  persistentVolumeReclaimPolicy: Retain
  claimRef:
    name: prometheus-volume-claim
    namespace: observability
  storageClassName: eks-efs-storage-class
  csi:
    driver: efs.csi.aws.com
    volumeHandle: fs-XXXXXXXXXXXX::fsap-XXXXXXXXXXXX
---
apiVersion: v1
kind: PersistentVolumeClaim
metadata:
  name: prometheus-volume-claim
  namespace: observability
spec:
  accessModes:
    - ReadWriteMany
  storageClassName: eks-efs-storage-class
  volumeName: prometheus-volume-0
  resources:
    requests:
      storage: 10Gi
Those who’ve been working with EC2 instances or EKS Node Groups using EBS will immediately recognize what we’re doing here, the values for file system and access point IDs come from the terraform snippet described above and go into volumeHandle: fs-XXXXXXXXXX::fsap-XXXXXXXXXX . With the storage configuration in place, let’s configure Prometheus for use in EKS. We’re doing a default deployment with only a few changes as a detailed customisation of the values.yaml is beyond the scope of this blog. Refer to prometheus.yaml file in this linked gist for deploying Prometheus to EKS. You’ll notice the job names
kubernetes-apiservers
kubernetes-nodes
kubernetes-nodes-cadvisor
kubernetes-service-endpoints
kubernetes-service-endpoints-slow
kubernetes-services
kubernetes-pods
kubernetes-pods-slow
These are Prometheus jobs defined to collect metrics from the EKS itself, to monitor the health of the Kube cluster too in addition to the microservices. Save the aforementioned file in the gist to a values.yaml file and Install the helm chart using the following command:
helm install -i prometheus prometheus-community/prometheus -f values.yaml -n observability
Let’s look at enabling collection metrics for a service written in Spring Boot. We’d simply refer to the configuration here, the spring boot actuator endpoint can be configured in the application or bootstrap YAML as follows:
management:
  endpoint:
    shutdown:
      enabled: true
scrape_configs:
  - job_name: "spring"
    metrics_path: "/actuator/prometheus"
    static_configs:
      - targets: ["0.0.0.0:${server.port}"]
When you deploy this service you’ll notice the metrics exposed by Spring Boot Actuator are available on Prometheus. You can access Prometheus via the URL exposed through the ALB ingress.
Grafana on EKS
Grafana will be deployed for visualising data collected by Prometheus. Let’s see how to get it done.
Deploying EFS volumes for Grafana
Assuming we have the EFS block configured for our EKS cluster, ref. this blog post, create a file grafana-volumes.yaml defining the volumes for Grafana as follows:
apiVersion: v1
kind: PersistentVolume
metadata:
  name: grafana-volume-0
  labels:
    type: grafana-storage-volume
spec:
  capacity:
    storage: 10Gi
  volumeMode: Filesystem
  accessModes:
    - ReadWriteMany
  persistentVolumeReclaimPolicy: Retain
  claimRef:
    name: grafana-volume-0
    namespace: observability
  storageClassName: eks-efs-storage-class
  csi:
    driver: efs.csi.aws.com
    volumeHandle: fs-XXXXXXXXXXXXXXX::fsap-XXXXXXXXXXXXXXX
---
apiVersion: v1
kind: PersistentVolumeClaim
metadata:
  name: grafana-volume-0
  namespace: observability
spec:
  accessModes:
    - ReadWriteMany
  storageClassName: eks-efs-storage-class
  volumeName: grafana-volume-0
  resources:
    requests:
      storage: 10Gi
Run the following command to create the volumes
kubectl apply -f grafana-volumes.yaml -n observability
Deploying Grafana via HELM chart
Download the helm chart for Grafana with the command:
helm repo add grafana https://grafana.github.io/helm-charts
The grafana.yaml file in this gist describes a basic Grafana configuration for working with Prometheus as a data source. We’re using mostly standard config here, adding Prometheus as a data source via the block
datasources:
  datasources.yaml:
    apiVersion: 1
    datasources:
    - name: Prometheus
      type: prometheus
      version: 1
      url: http://prometheus-server:80
      access: proxy
Save it as values.yaml and deploy the Grafana helm chart by running the following command
helm install -i grafana grafana/grafana -f values.yaml -n observability
Here again, you can access Grafana using the configuration on the ALB Exposed URL.
Grafana Dashboards
Now that we have the infrastructure in place, let’s see how can we use it for Observability. I’ll limit examples to Spring Boot for simplicity. Our microservices expose REST APIs and use MongoDB for data persistence. Here’s what we recommend monitoring for such services.
Spring Boot Microservices

Spring Boot Observability Dashboard
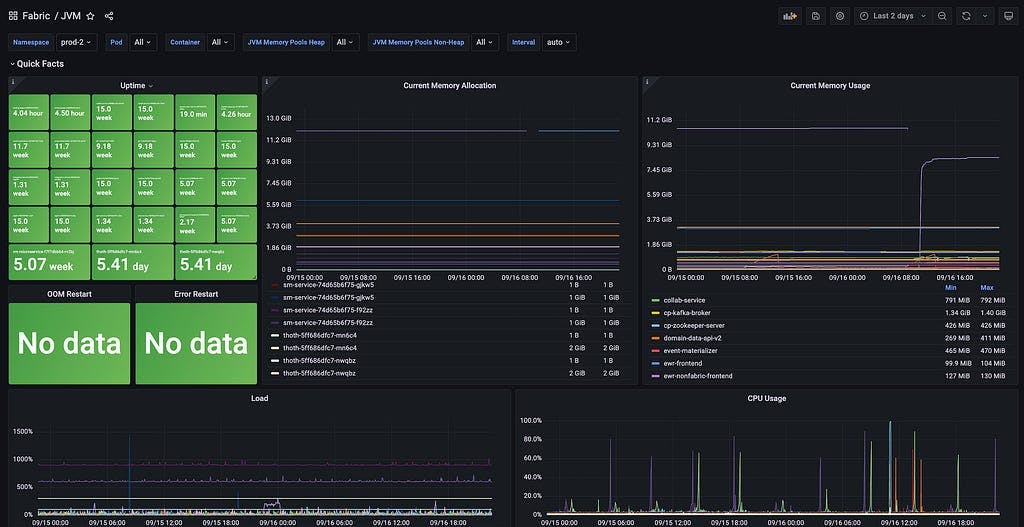
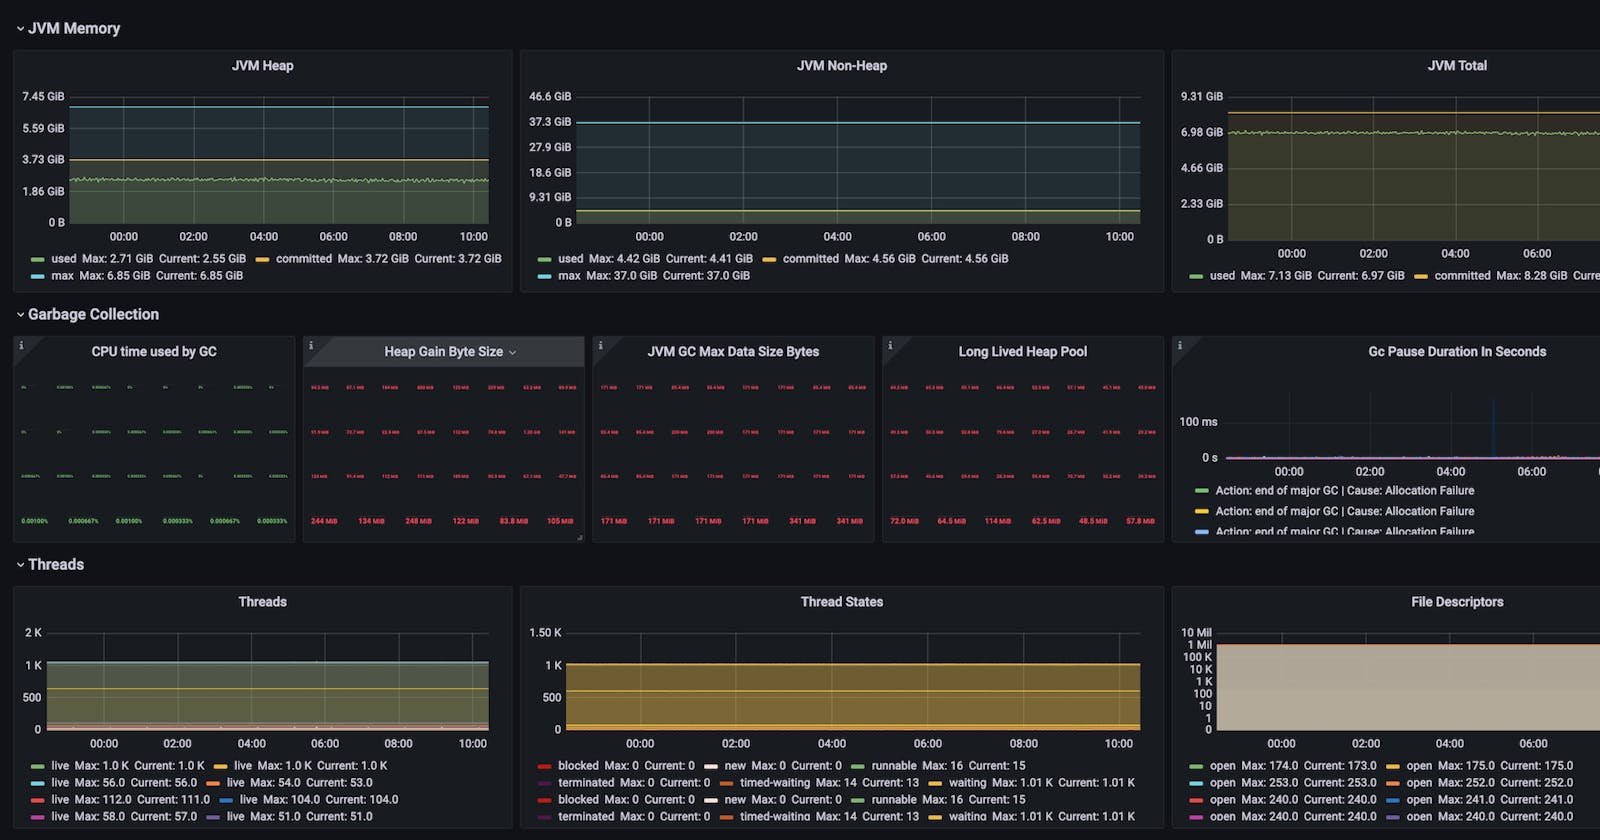
Here are the panels we’ve added to the Grafana dashboard for monitoring Spring Boot Microservices.
Quick Facts
Uptime Monitor: total uptime of pods, can be filtered over namespace, pod names and containers
Current Memory Allocation: current total memory allocated to pods, can be filtered over namespace, pod names and containers
Current Memory Usage: average memory consumption by app containers in each pod
CPU Load
CPU Usage
FATAL, ERROR and WARN logs count
MongoDB
Repository Method Execution Time: Total time taken per method per repository, a high value indicates a performance issue
Repository Method Execution Count: Number of methods executed against each of the repositories, gives an idea of traffic on each collection
Repository Method Avg Execution Time: Total time taken per method per repository, a high value indicates a performance issue
Repository Method Execution Max Time: Max recorded time of each MongoDB operation
Time in Seconds of Operations Per Collection: The maximum time in seconds it took to execute a particular command on a MongoDB collection. This is the worst-case unit. You can use it to identify the slowest operations per collection in your app.
Number of Commands Per Collection Per Second: The number of commands executed on each of the collections per second, helps you optimise collections sharding, and indexing to suit the read/write operations
Operations Average Time Per Collection: The average time of various operations running in a collection, this is a quick view to spot the slowest transactions for an app
Mongo Operation Max Time: max time of operation on each of the collections, this gives a sense of what might be skewing the quick view averages in the previous panel
The Dashboard config JSON with the aforementioned panels and additional ones for measuring Java Heap, Thread and GC Details can be imported from the springboot.json file in this gist.
Summing it up
Setting up observability for Microservices isn’t quite intuitive but not an uphill task given the tools at our disposal. Having said that, this is pretty much the starting step of your observability journey. Once you have the infra setup as demonstrated in this blog, you have to meticulously design the graphs you will create in Grafana, which in turn depends on the kind of services you are running, and the parts of your system that you want to track. This blog aims to help fellow SRE and DevOps engineers find the steps in this blog helpful enough to be able to set up their observability stack.


